
 PricewaterhouseCoopers has just released its comprehensive annual study of U.S. patent litigation, covering the period from 1991 through 2013. Examining everything from litigation success rates, time-to-trial and median damage awards to comparisons of judges, districts, jury v. bench trials and non-practicing entities (“NPEs”) v. practicing entities (“PEs”), the report is a treasure trove of fascinating statistics.
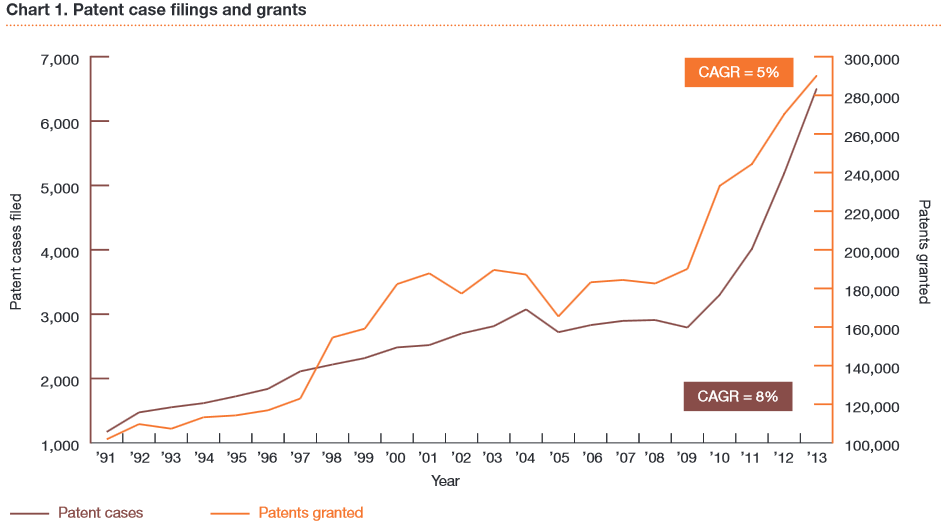
The report concludes that, “in some ways, 2013 appeared to be a moderating year in patent infringement litigation,” with fewer mega-damage awards and a continuing decline in median damages, but on the other hand, “both the number of patent cases filed and the number of patents granted continued to grow rapidly in 2013 – by 25% (to almost 6,500 cases) and 7% (to almost 300,000 patents) respectively.”
Just a few highlights of the report are set forth below:
Patents Issued and Lawsuits Filed
• Number of patents issued by the USPTO increased at 5% annually since 1991.
• That figure increased to 11% annually since 2009.
• Number of patent lawsuits filed increased at 8% annually since 1991.
• That figure increased to 24% annually since 2009.
Median Damages Awarded
• Median damages awarded peaked about 2000-2004 at $7.5 million.
• By 2010-2013, that figure declined to about $4.3 million.
• In 2010-2013, NPEs received median damage awards of $8.5 million, compared to $2.5 million for PEs.
Ten Largest Damage Awards 1995-2013
• Three of the top-ten awards came in 2012, with each of those exceeding $1 billion.
• The largest award in 2013 was $228 million, too small to make the list.
Jury v. Bench Trial
• In 1995-1999, patent owners had a success rate of 81% in jury trials, compared to 43% in bench trials.
• That difference has been steadily shrinking; in 2010-2013 those figures were 74% and 64%.
• However, in 2010-2013, median damages awarded by jury trial was $15 million, compared to $400,000 by bench trial.
NPE v. PE Success Rates
• From 2010-2013, NPEs have an overall success rate of 26%, compared to 38% for PE patent owners.
• At summary judgment, those figures are 3% for NPEs and 10% for PEs.
• University/non-profit NPEs have a 45% success rate, compared to 31% for corporate NPEs and 18% for individual NPEs.
Top Ten Industries
• Most suits involve consumer products, then biotech/pharma, industrial and computer hardware.
• Greatest median damages go to telecom, then biotech/pharma, medical devices and computer hardware.
• Greatest success rate goes to medical devices, then biotech/pharma, computer hardware and consumer products.
District Court Rankings (1995-2013)
• Greatest overall success rate for patent holders goes to E.D.Texas (57%), then M.D. Florida (54%).
• Largest median damages goes to S.D. Texas ($57 million), then E.D. Virginia ($37 million).
• Greatest success rate for NPEs goes to W.D. Penn. (67%) M.D. Florida (63%).
• Lowest success rate for NPEs goes to D.C. (0%), Maryland (0%) and E.D. Mich. (0%).
The full report is available HERE
If you have any questions or require assistance, contact a patent attorney.